Performance
Performance provides all the front-end performance data you need to speed up your application and improve the user experience.
Performance will help you:
- Identify poor performance
- Diagnose the root cause
- Measure the impact of performance optimizations
Performance metrics
Real User Monitoring captures a number of metrics to help you identify poor performance and measure the impact of optimizations.
For more information on the metrics captured by Raygun see the performance metrics documentation.
note: You can use Raygun custom timings to track your own custom performance metrics.
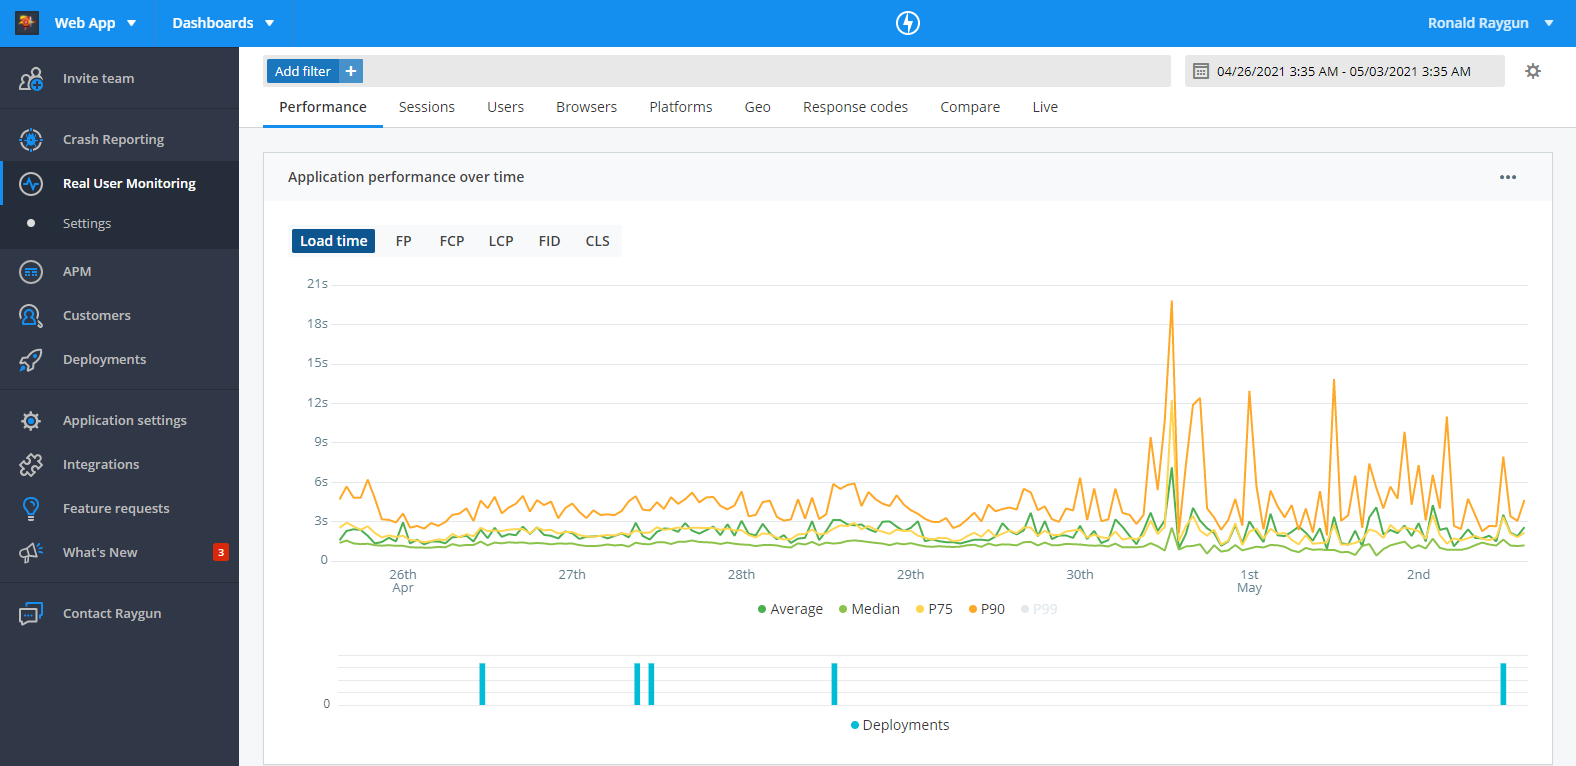
Line graph
The line graph visualizes the Average, Median, P75, P90, and P99 of each performance metric over the time range selected, enabling you to see the trend in overall front-end performance of your software.
Controls:
The dropdown in the top right hand corner of the chart can be used to toggle between different metrics.
The graph displays lines for the Average, Median, P75, P90, and P99. You can hide each line by clicking the corresponding label in the key at the bottom of the graph.
Metrics:
For more information on the metrics displayed in the line graph, and what they're measuring, see the performance metrics documentation.
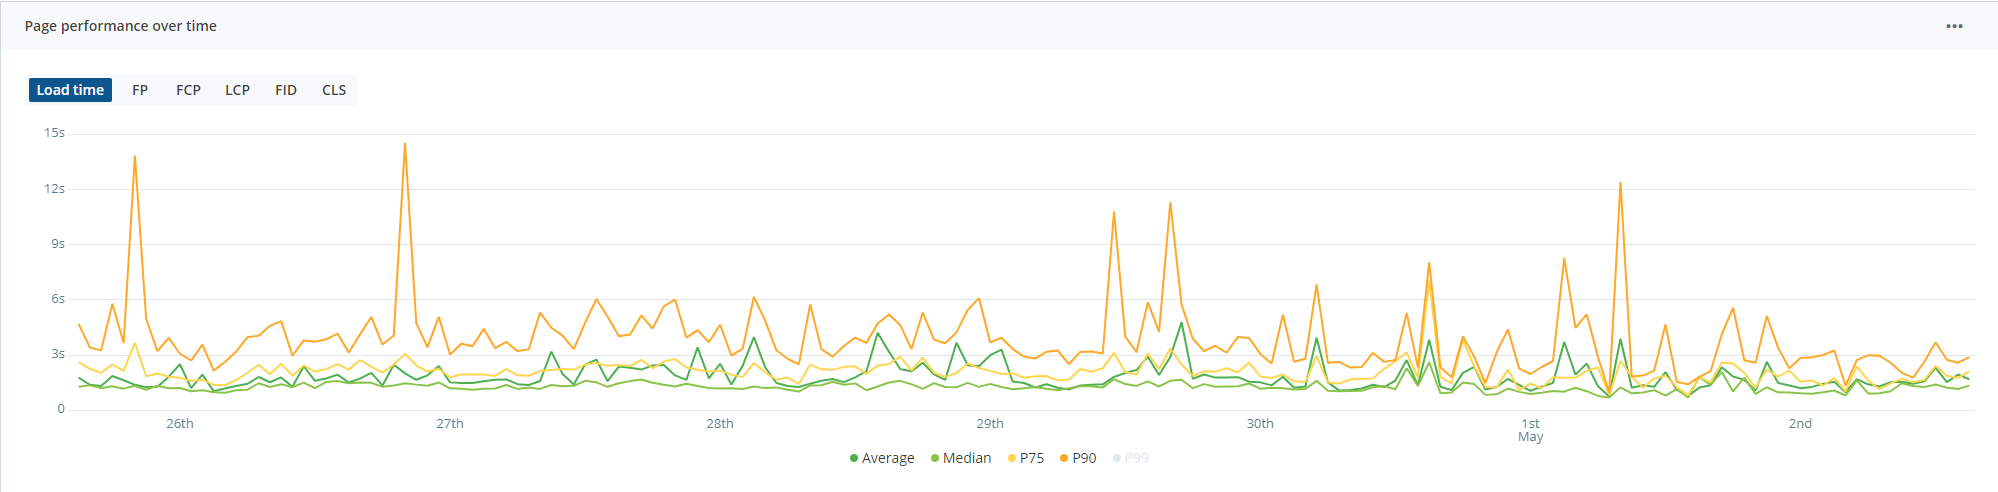
Understanding performance for specific pages & XHRs
You can find performance details for a page, virtual page, or XHR by clicking on the hyperlinked route from any one of the tables on the performance page.
The tables on the performance page highlight different areas of your application to focus on.
- Most requested pages
- Most viewed virtual pages
- Slowest & most requested pages
- Slowest pages by client time (the portion of load time that takes place on the client)
- Slowest pages by server time (the portion of load time that takes place on the server)
- Most requested XHR
You can also use the URI search (below the line graph on the performance page) to search for a particular URI. You can search with either full routes or keywords.
See our documentation for more information on the performance details page.
Using filters
The filter bar at the top of the performance page can be used to refine the dataset, helping you identify performance issues based on particular parameters such as geography, device, browser, custom tags and more.
For more information, see the documentation on using filters in Real User Monitoring.
Custom timings
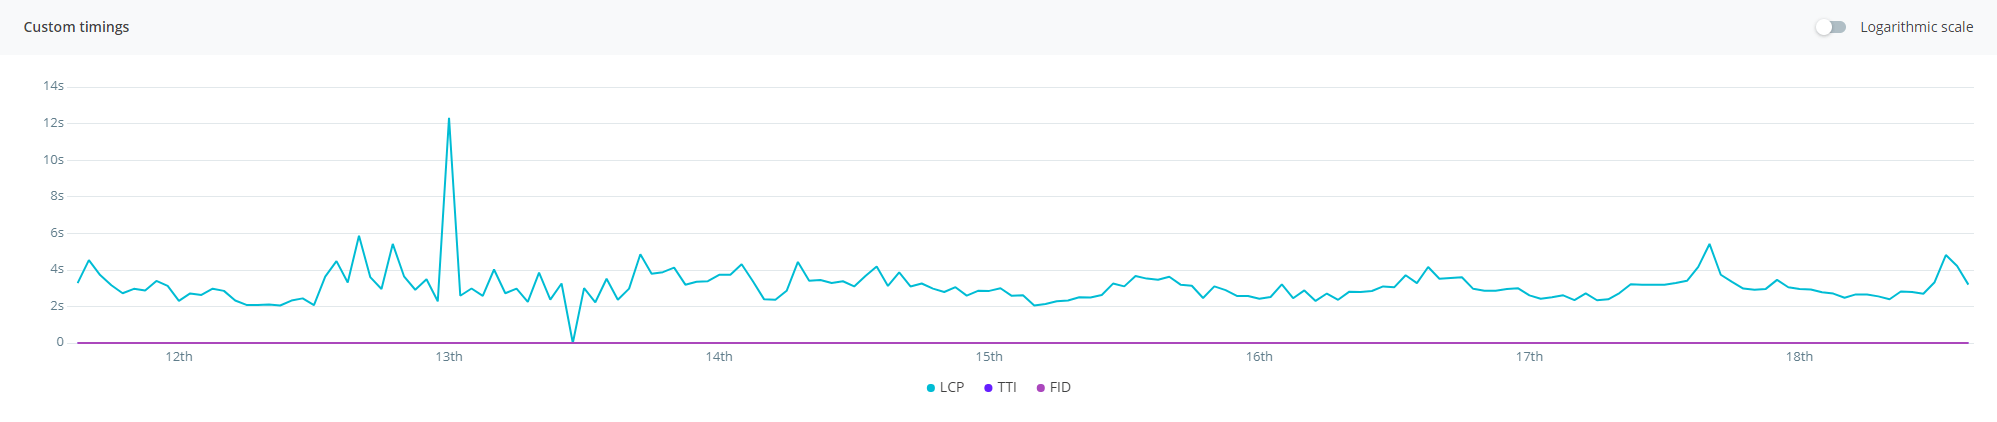
You can track custom performance measurements across your website or application using custom timings in Real User Monitoring. For example, you might track the time it takes for a specific video to play, or for the search bar to load.
For more information on custom timings, and how to configure them, see the custom timings documentation.
Exporting to CSV
Performance data is available to be downloaded in CSV format. This can be done by clicking the settings icon on the module that you wish to export data for and selecting export CSV. Some important points to note are:
- Export CSV functionality will export data within the date range selected.
- For performance reasons the number of records exported is limited to 1000.
- Export CSV does not conform to top level filters, meaning data exported will not match any filter criteria applied.
note: For performance reasons, we limit the number of records exported to 1,000.