Dashboards
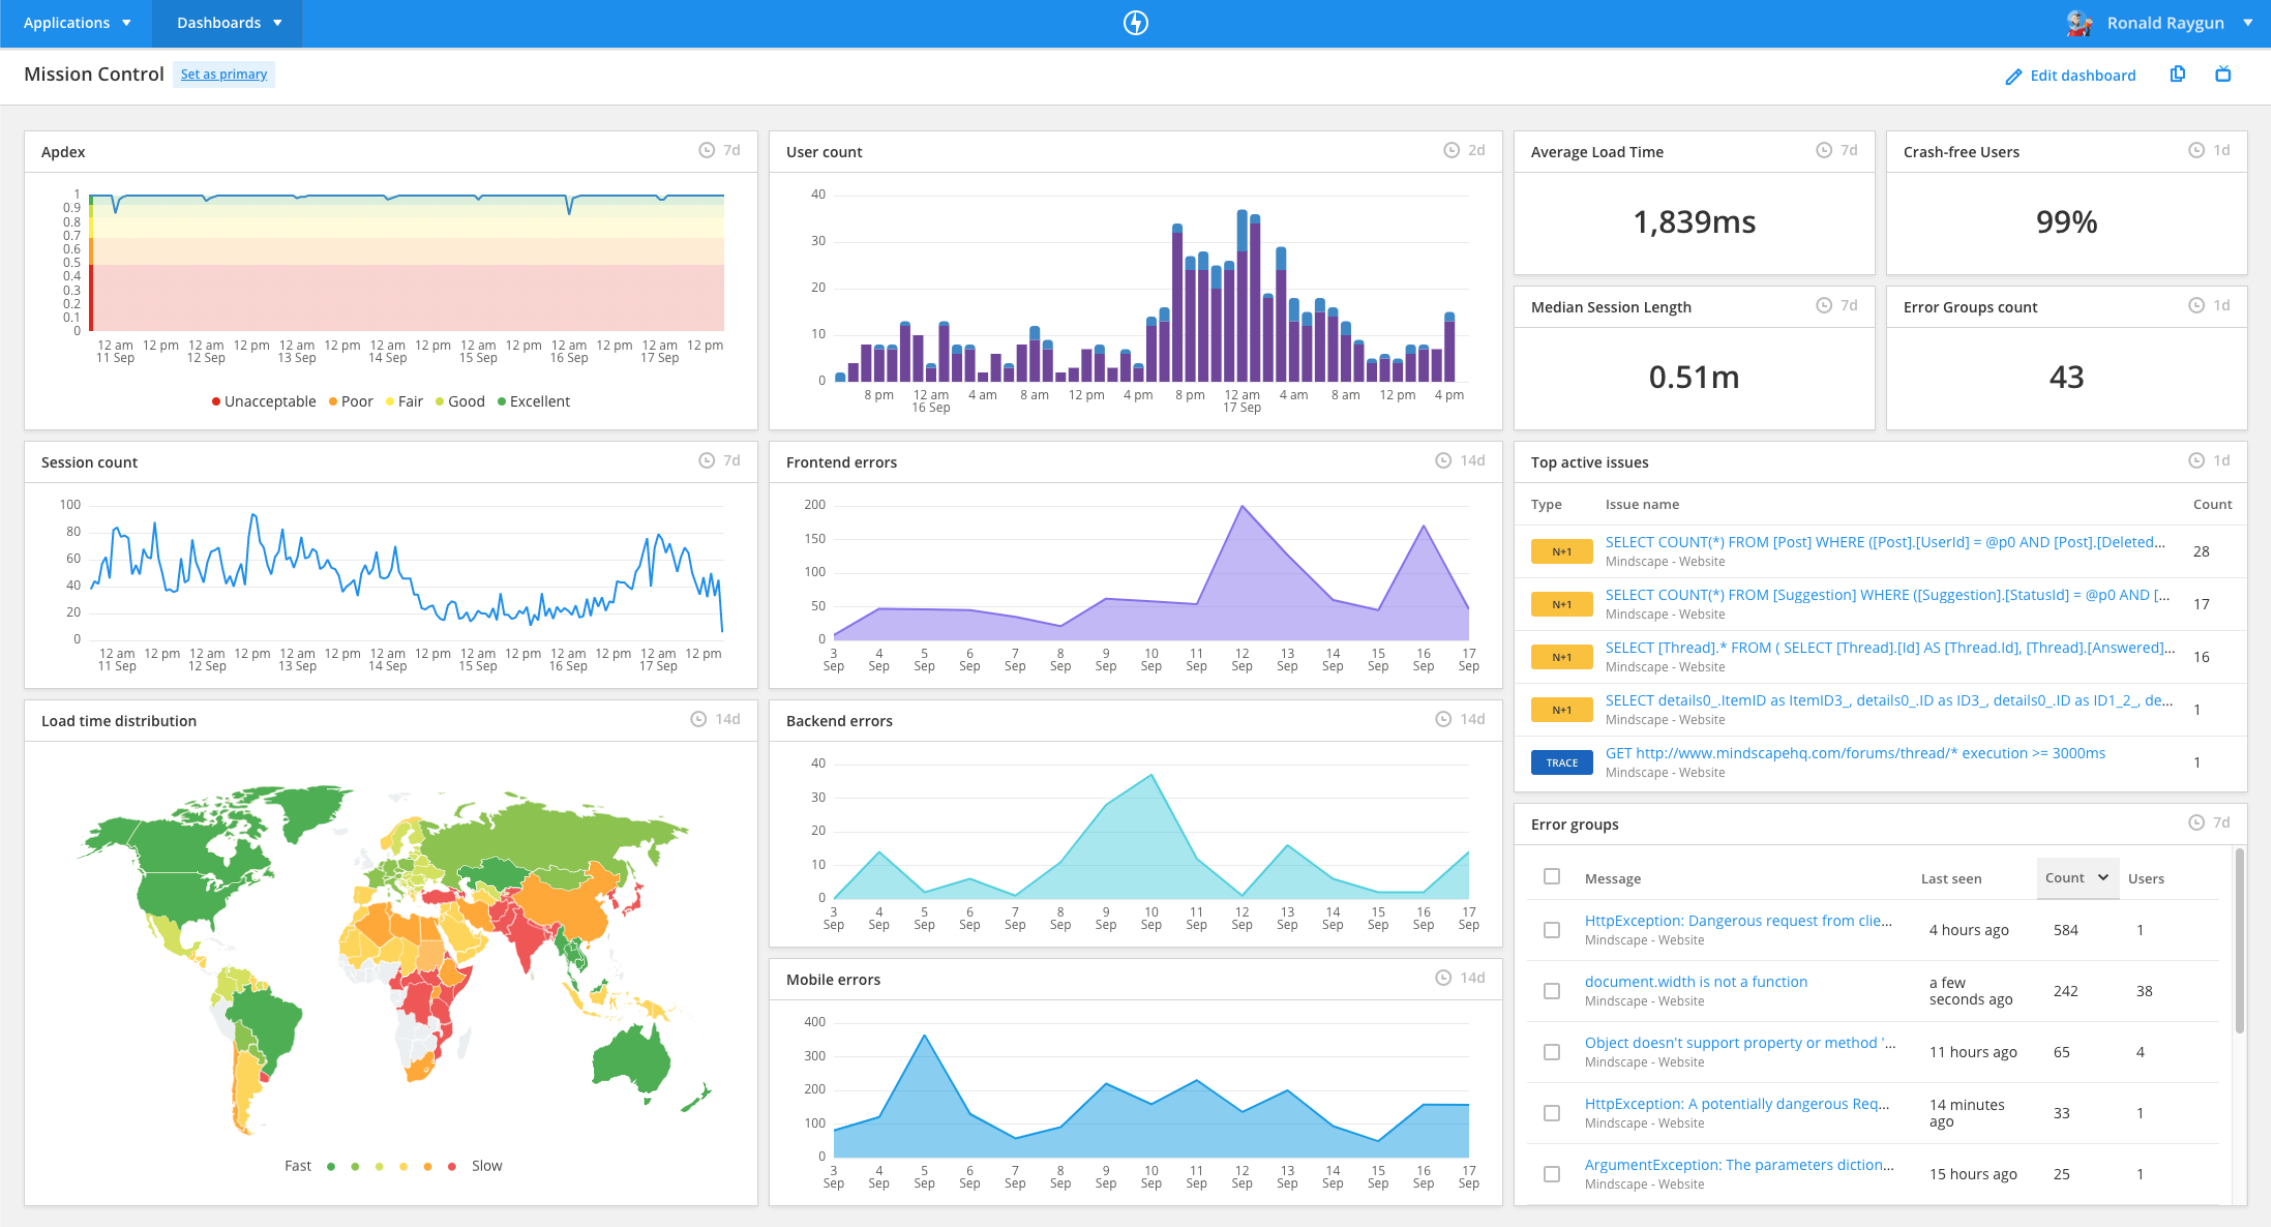
Raygun Dashboards visualize critical error and performance data to give insight into your software health at a glance. You can stream data from multiple applications into the same dashboard to monitor different environments or parts of your software from one place. Dashboards help you stay on top of errors and performance issues in your software, and react to new issues faster.
Find your Dashboards
Click 'Dashboards' in the top left-hand corner of Raygun to open the dashboard switcher. This works in the same way as the application switcher which is used to navigate between applications. Click on a dashboard title in the switcher to navigate to it.
If you are a member of multiple Raygun plans you can view the dashboards on each plan by clicking the plan avatar on the left-hand side of the dashboard switcher.
Create a new Dashboard
- Click 'Dashboards' to open the dashboard switcher.
- Click 'Create dashboard'.
- This will navigate you to your new dashboard, in editing mode.
- Click the pencil icon next to the dashboard name in the top left-hand corner to rename your dashboard. Give your dashboard a unique name so you'll be able to find it easily in future.
- Add tiles to your dashboard.
- Click 'Save changes' in the top right-hand corner.
Edit Dashboards
To make changes to a dashboard you need to first click 'Edit dashboard' in the top right-hand corner to switch into editing mode.
Add a tile
Raygun Dashboards are made up of tiles that visualize different data. For example a tile might display a list of errors, or a time series chart of user sessions. Here's how to add a tile to your dashboard.
- In edit mode, click the icon for the tile type you wish to add from the four options in the centre of the sub-header menu. The dropdown will appear, and you can click the tile name you wish to add to the dashboard.
- Upon clicking on the tile name, you'll be presented with a modal to configure the tile. The options will vary across tile types, but you'll need to configure the tile before adding it to the dashboard. (Don't worry, you can adjust the tile configuration later if need be).
- Once you've selected your configuration preferences, click 'Add tile' to add the tile to your dashboard.
Adjust tile layout and size
Move a tile on the dashboard by clicking and holding the left mouse button over any non-interactive area of a tile, and dragging it to another place on the grid. To resize a tile, drag the arrow in the bottom right corner of any tile.
Configure tiles
Any options you configured when adding a tile can be revisited. Make sure the dashboard is in edit mode, then click the settings cog in the top right-hand corner of a tile to open the configuration modal and update the tile.
If you only wish to change the tile title click pencil icon next to the title when the dashboard is in edit mode.
To delete a tile, click the trash can icon next to the settings cog icon in the top right-hand corner of a tile.
Clear all tiles
If you want to start from scratch you can clear the dashboard by clicking the "Clear" button near the left-hand side of the edit bar whilst in edit mode.
Rename a dashboard
While in edit mode, a pencil icon will appear next to the dashboard's header. Click on the pencil icon to edit the dashboard title.
Cancel changes
Click the "X" button next to 'Save changes' on the right-hand side of the edit bar to revert any changes and switch the dashboard out of edit mode.
note: Any changes you make need to be saved by clicking the 'Save changes' button on the top right-hand side of the dashboard.
Advanced Features
Multiple applications in one dashboard
Raygun dashboards can visualize data from multiple applications to provide a view of software performance over different environments or parts of your software. There are a couple of ways to achieve this.
-
Combine data from multiple sources (applications) into the same tile. In the tile configuration settings, you'll find an 'Add Sources' dropdown at the bottom of the modal. Click this dropdown, and select applications from the list. This will overlay data from the different applications in the same tile.
-
Add multiple versions of the same tile and configure each to display data from a different application. This way you can visualize the same data from different applications side-by-side.
TV mode
TV mode allows you to display Raygun dashboards on monitors or TVs, so you can monitor software quality and performance in real time. You can enable TV mode by clicking the TV icon on the right hand side of the header bar. Information displayed on your dashboards will update automatically every few minutes.
Favorite Dashboards
Favorite dashboards for easy access to those you use the most.
- Click "Dashboards" in the header menu to open the dashboard switcher.
- Find the dashboard you wish to favorite in the list.
- Click the star on the right-hand side of the list to favorite a dashboard.
- That dashboard will now appear in your favorites at the top of the dashboard switcher.
Filtering tiles by error status
Certain Crash Reporting tiles can be filtered by error statuses.
The tiles that can be filtered by status are:
- Error count
- Error group
- Errors per app
- Error instances
- Error group count
To apply a status filter:
- Navigate to the tile configuration modal by clicking 'Edit dashboard', and clicking the settings cog on the tile.
- In this configuration modal you'll see the 'Statuses to include' list. Check the box next to error statuses in this list that you wish to include.
- Click 'Update tile' to save your changes. This tile will now display data from error groups marked with the status/s you selected.
tip: When filtering a Crash Reporting tile by error status, we recommend updating the tile to ensure other team members are clear on the data being displayed.
Updating error group statuses
All Crash Reporting list tiles on a dashboard allow you to update the status of an error group.
This can be done by selecting the error groups you wish to update using the multiselect then click the 'change status' button.
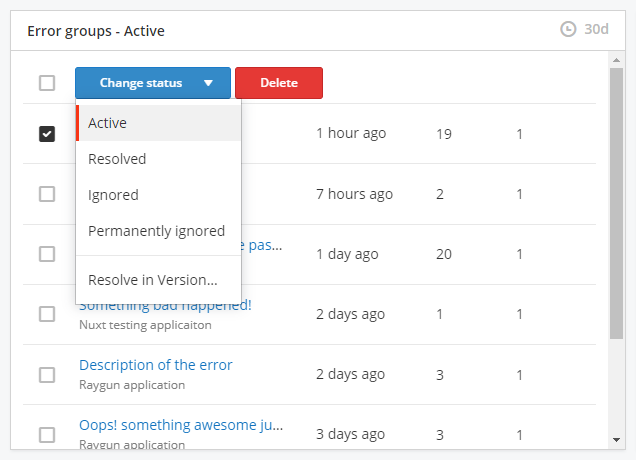
Details on the different error group statuses can be found here.
Primary Dashboards
Primary dashboards can be customized like any other dashboard, but have a few special characteristics. The Primary dashboard starts off with a preset layout using data from your top 5 applications. The primary dashboard cannot be deleted.
Resetting the primary dashboard
The Primary dashboard has a reset function to replace everything on the dashboard with the preset tile layout. This can be done using the 'Clear/Reset' option in the top left-hand corner of the dashboard when in edit mode.
Deleting a dashboard
If you have a dashboard that you don't need anymore, you can delete it while the dashboard is in edit mode.
- Navigate to the dashboard you wish to delete, and click 'Edit dashboard' on the right-hand side of the sub-header.
- Click the "Delete" button on the left-hand side of the edit bar.