Getting Started
Now that you’ve signed up for Real User Monitoring, we’re here to help you get started. This guide will help you set up your Raygun account, and discover performance problems impacting your end users.
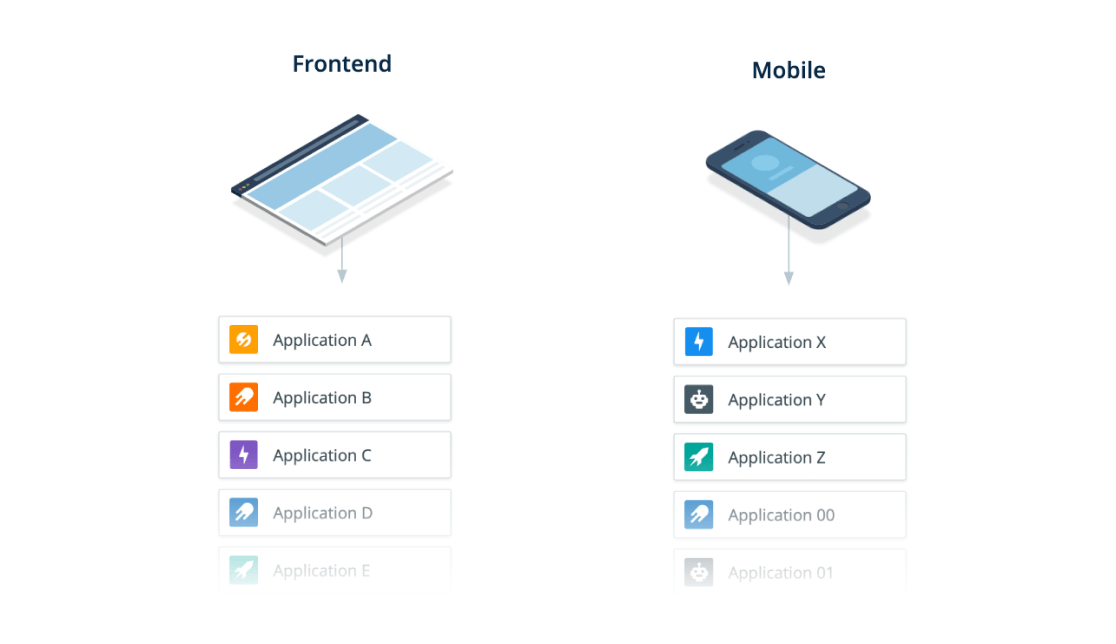
Create an application in Raygun
As a first time user, you may be wondering what an application is. You can think of applications as containers used to segment data inside Raygun. With unlimited applications, you can monitor any number of different software projects and development environments within one Raygun account.
For more information, see the guide to structuring applications in Raygun.
Send data to Real User Monitoring
After creating your application, you’ll be presented with the Real User Monitoring setup instructions in Raygun. Select your language in the dropdown, then follow the steps to start collecting data.
We recommend installing Real User Monitoring in a production environment. This allows you to capture data from the experience of real users, to gain the most accurate insights into software performance.
Setup Instructions
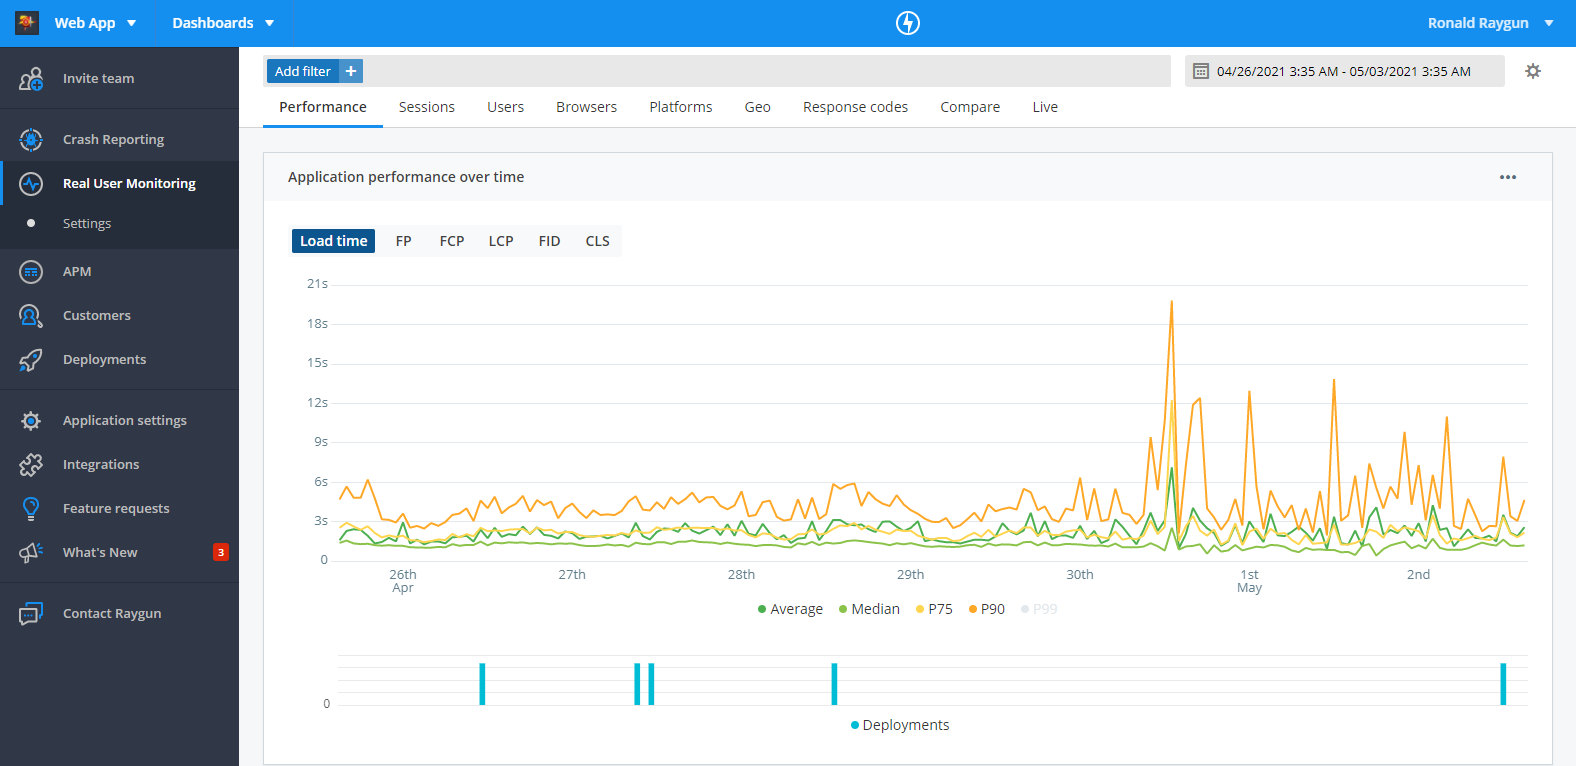
View performance data
Now that Real User Monitoring is capturing data, you can view the diagnostic information on the performance of different pages, virtual pages, and XHRs in your application.
To find this data, navigate to the ‘Performance’ tab in the header menu. This page provides all the diagnostic information Real User Monitoring collects on the performance of your application. Click into a URI in the table, to drill into performance data for that specific page.
See this page for an in-depth guide to the performance page, the data that Raygun collects, and how to identify performance issues using Real User Monitoring.