Low overhead mode
Introduction
.NET / .NET Core profiler works by receiving notifications about each method starting and each method finishing. After it receives those events, it has to perform some computations required to build a trace. The performance impact of these computations is small for a single method, but when running hundreds or thousands of methods it adds up and can become significant.
To solve this problem we introduced the Low Overhead Mode. In this mode APM will not trace frequent methods to prevent them from slowing the application down.
Low Overhead Mode is supported from Agent version 1.0.1271 and up.
Questions and answers
How do I turn it on / off?
.NET Framework
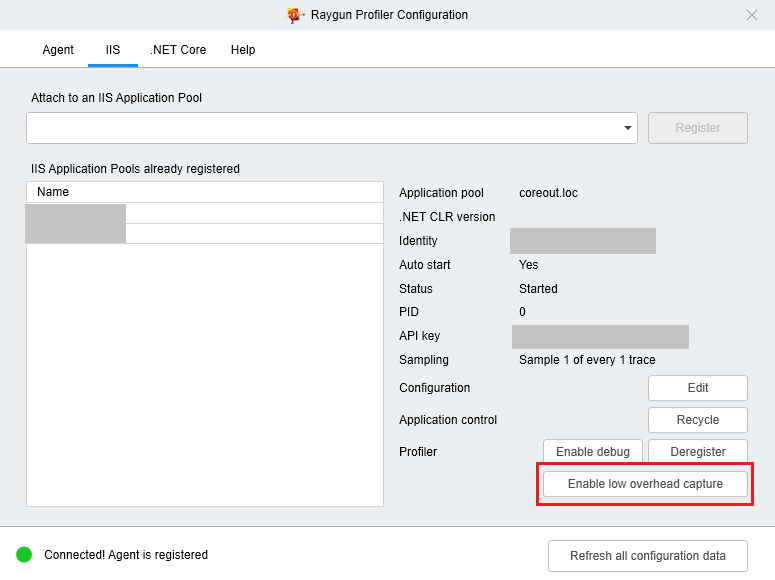
For .NET applications we added a button to IIS tab of Raygun Configuration Tool to enable the mode as shown on the image below:
You can also use console rgc tool.
.NET Core
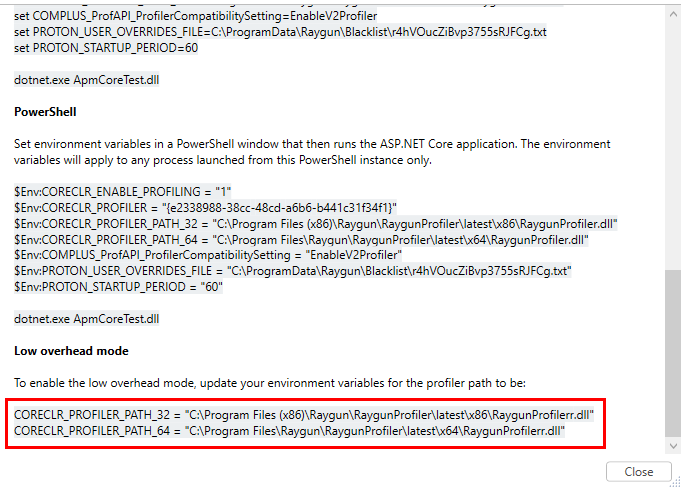
For .NET Core applications, environment variables for the process (in web.config or powershell) will need to be updated. To do that, go to the .NET Core tab and click "Show Config".
Then scroll down to the Low overhead mode section.
The environment variables are displayed there, as per the image below:
Azure App Service
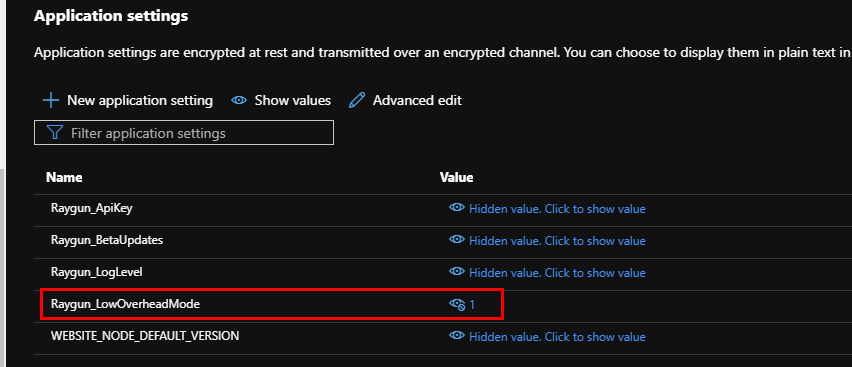
In Azure App Service, add new Configuration value Raygun_LowOverheadMode = 1 as shown on the image below:
Then you will need to:
- Restart
RaygunAPMweb job - Restart your application
Are the traces still correct?
Yes, DB queries, API calls and any method from the include list will appear in the traces. All the method timings will also stay correct.
How big is the performance boost?
It depends on how many short and quick methods are there in the application. In some cases we observed a 10X performance improvement.
How does APM decide to stop profiling a method?
APM will stop profiling a method if it sees it being executed more than 10 times a second in any single thread.
What versions of .NET / .NET Core are supported?
.NET Framework 4.5 or later, .NET 6+